
⏰ Notion Analytics
May 10th, 2022 began my 30-day content challenge where I publish one piece of content every day for a month. I’m one week into the challenge and I want to share the homepage I built in Notion to track my progress daily and weekly. Have you ever wondered how to effectively compare data between database rows in Notion? This use-case may be helpful. Here is how it works.
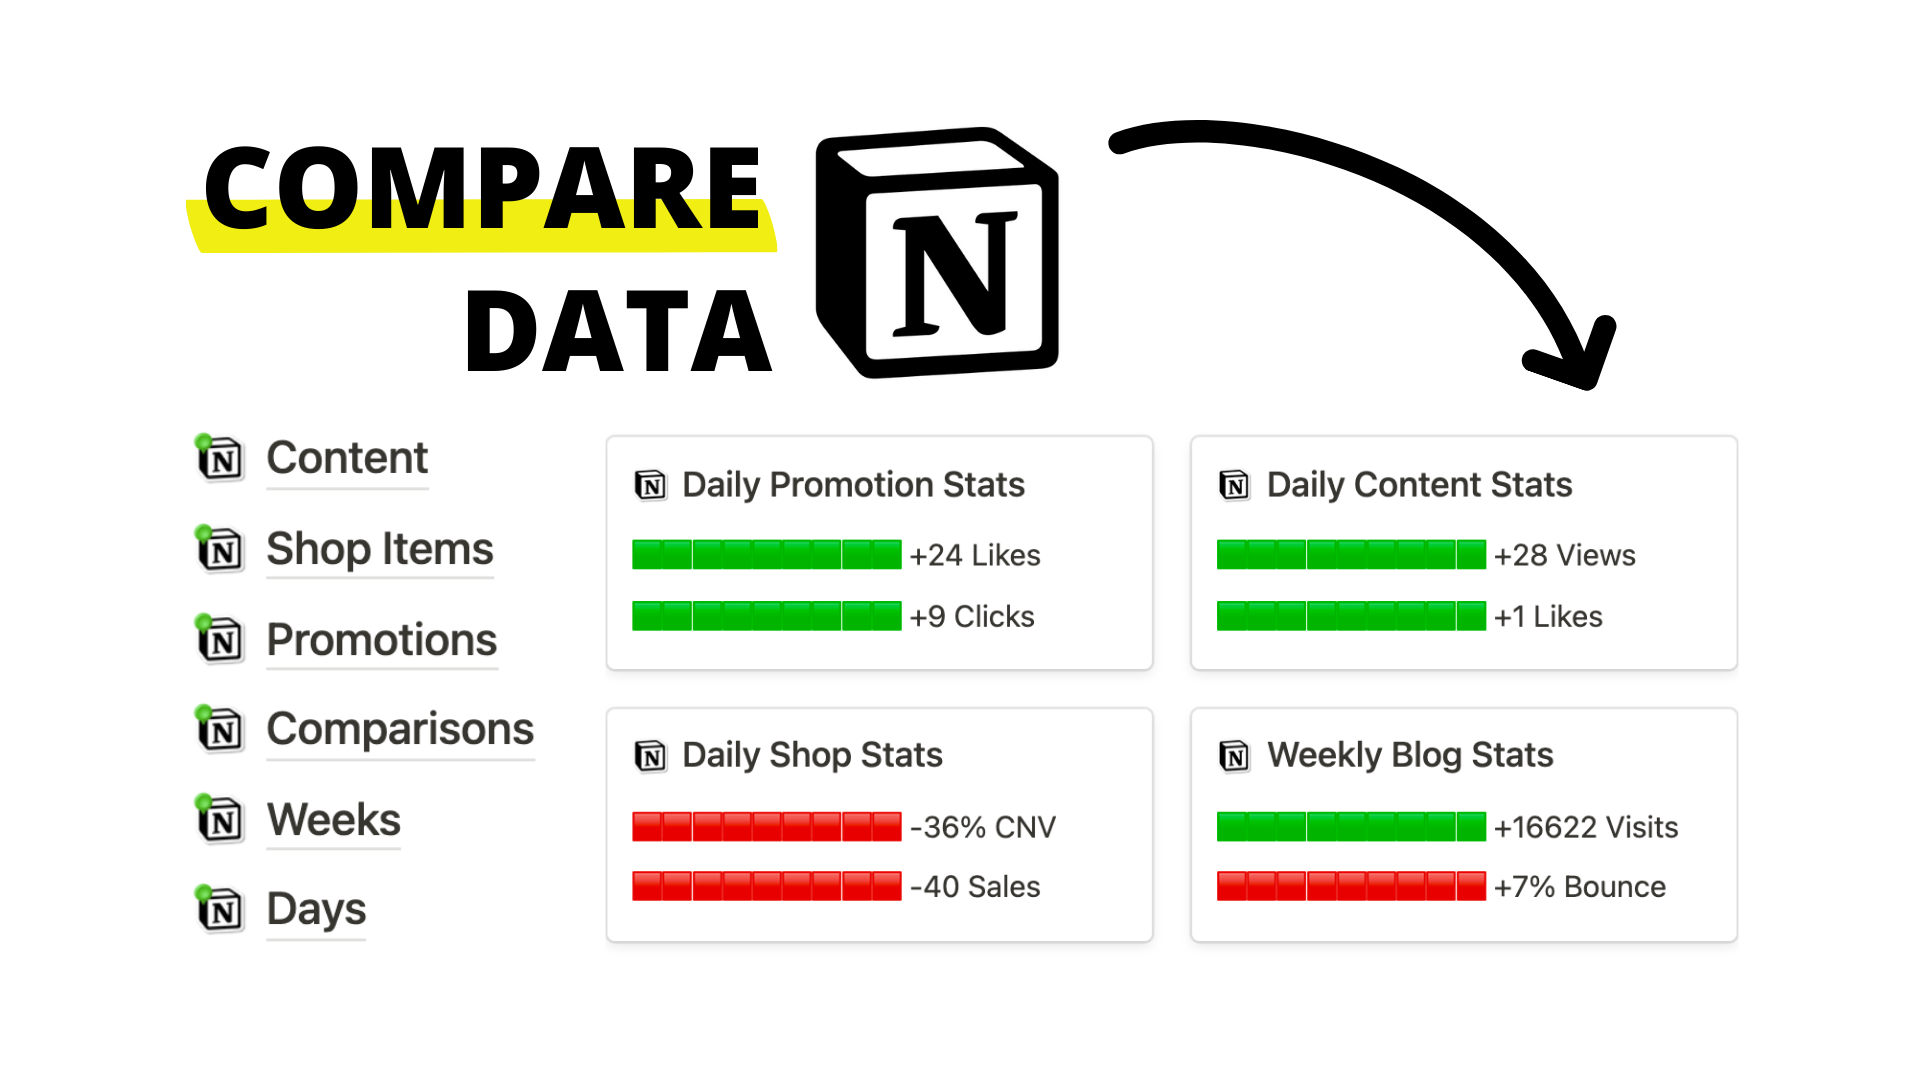
My 30-Day Challenge Homepage
This homepage has a Daily Progress Bar to simply count down progress from the start to end date. There is a portal for Weeks to add content, shop items, and promotions launched in the corresponding week.
There is one last portal for Comparisons. This linked database shows me three daily comparisons between the two latest statistics for promotion clicks, content views, shop conversion rate and more. The fourth is a weekly comparison of data from the last two weeks for my blog including visits and bounce rate.
How I Compare Latest Data
I quickly add new content and stats through the weeks database. That is why I placed it at the top of my homepage dashboard.
There is one page labeled Week 0 for data the week before the challenge, and another page labeled Week 1 for the first week of the challenge.
There are three data properties to track how many blog views, blog visits, and the bounce rate my blog has every week. I compare my weekly stats through a relation to my Comparisons database labeled Compare. There is a page in Comparisons I connect every week to called Weekly Blog Stats.
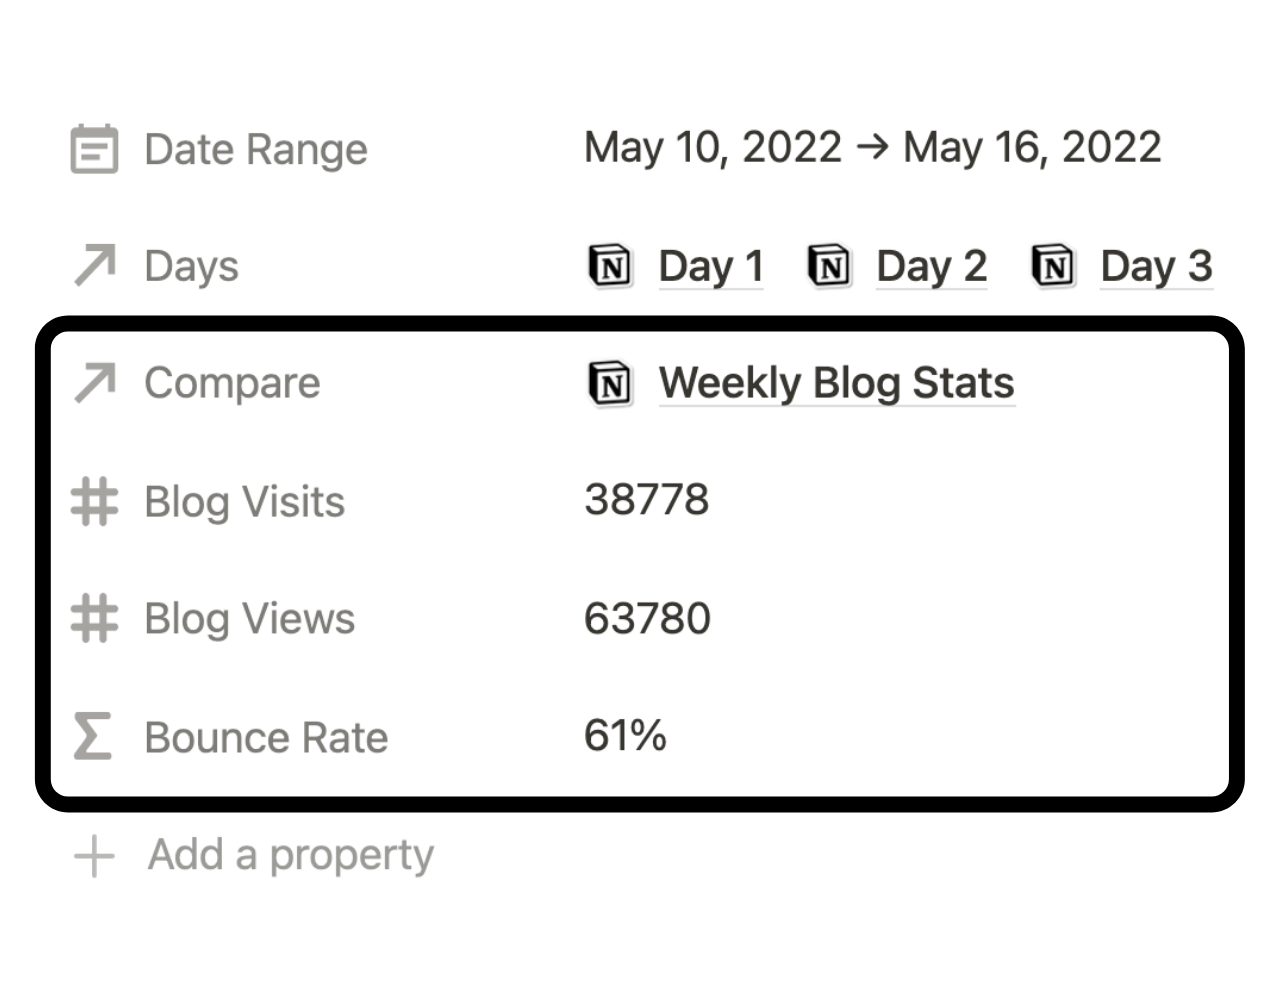
Inside the Weekly Blog Stats page I can collect all data from the Weeks database now including Blog Visits and Bounce Rate. To do this inside the Comparisons database, I create two rollup properties.
Using a formula, I can find the difference between the last two additions to the page. This allows me to visualize my progress between them.
I’m able to grab a list of data from my Weeks database via the rollup property.
The Formula
Above, Name of Page is Weekly Blog Stats.
The Name of Rollup is Blog Visits.
The Variable is Visits.
if(contains(prop("Name"), "NAME OF PAGE") and not empty(prop("NAME OF ROLLUP")), if(toNumber(replace(prop("NAME OF ROLLUP"), ".*[,]", "")) - toNumber(replace(replace(prop("NAME OF ROLLUP"), ",(?:.(?!,))+$", ""), ".*[,]", "")) >= 0, "🟩🟩🟩🟩🟩🟩🟩🟩🟩 +" + format(toNumber(replace(prop("NAME OF ROLLUP"), ".*[,]", "")) - toNumber(replace(replace(prop("NAME OF ROLLUP"), ",(?:.(?!,))+$", ""), ".*[,]", ""))) + " Variables", "🟥🟥🟥🟥🟥🟥🟥🟥🟥 " + format(toNumber(replace(prop("NAME OF ROLLUP"), ".*[,]", "")) - toNumber(replace(replace(prop("NAME OF ROLLUP"), ",(?:.(?!,))+$", ""), ".*[,]", ""))) + " Variables"), "")
How I Automate Connection To Stats
I add all blog content in my Content database. Page views and Likes and other data 24 hours after publishing. Every addition is also connected to its corresponding day in the challenge as seen below.
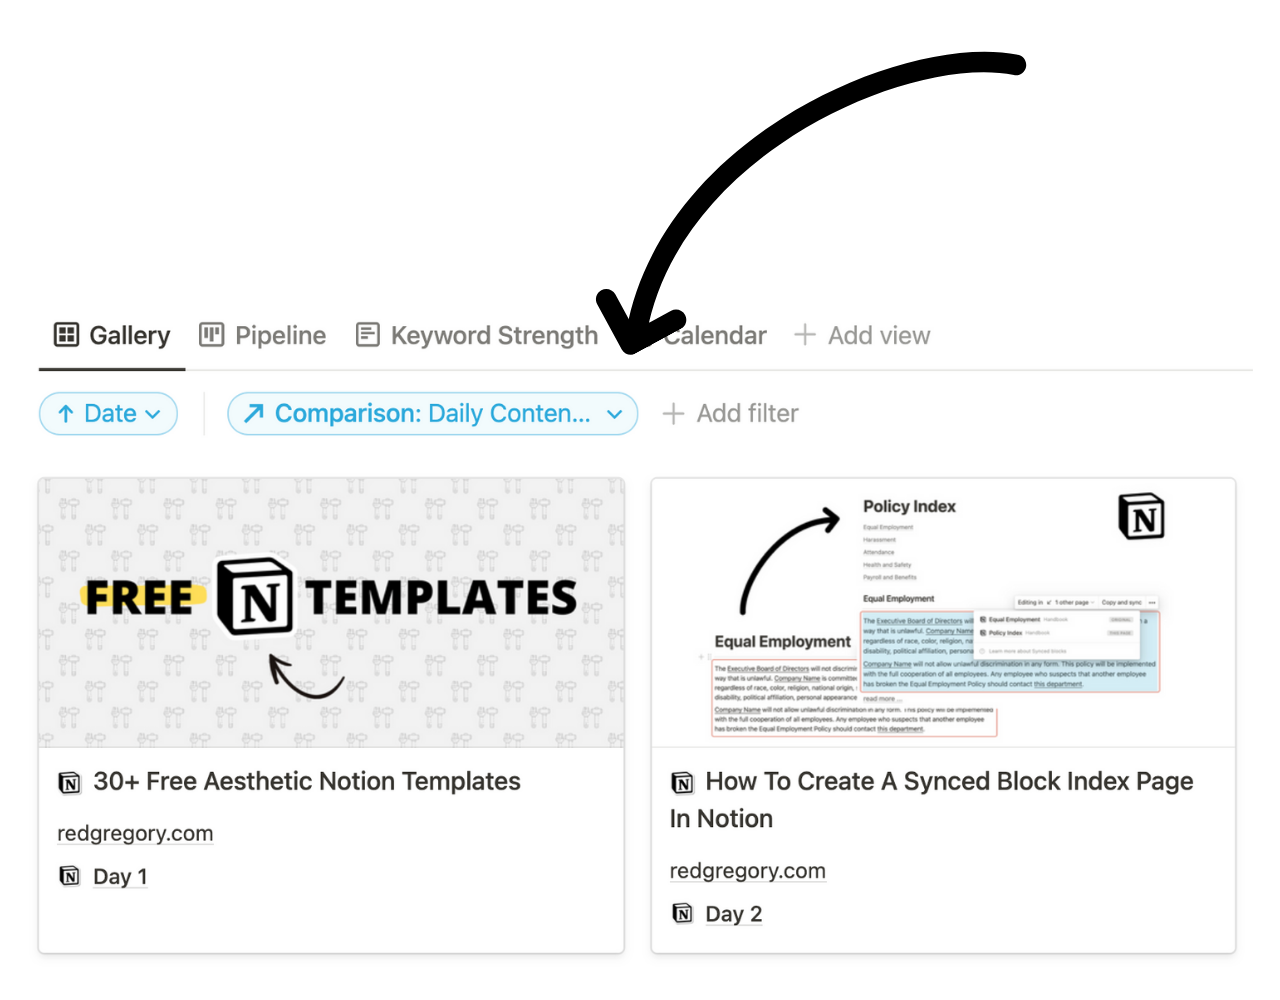
Similar to how I connect my Weeks database to Comparisons, I also connect every content entry to Comparisons. Every entry is connected to a page in the Comparisons database labeled Daily Content Stats. To make this connection automatic, I created a filter that looks like this:
Extra: My Daily Progress Table
If you want to start a 30-day challenge, this simple progress bar can be useful. The only information you’ll need is a Start Date (date property) and Days (number property) of the challenge.
slice("■■■■■■■■■■", 0, floor(10 * dateBetween(now(), prop("Start Date"), "days") / dateBetween(dateAdd(prop("Start Date"), prop("Days"), "days"), prop("Start Date"), "days"))) + slice("□□□□□□□□□□", 0, 10 - floor(10 * dateBetween(now(), prop("Start Date"), "days") / dateBetween(dateAdd(prop("Start Date"), prop("Days"), "days"), prop("Start Date"), "days"))) + " " + format(floor(100 * dateBetween(now(), prop("Start Date"), "days") / dateBetween(dateAdd(prop("Start Date"), prop("Days"), "days"), prop("Start Date"), "days"))) + "%"