
🔎 Analytical Habit Tracker
With the addition of Notion’s new progress bar feature, habit trackers can now include analytical properties with rollups. Notion allows the rollup property to produce progress bars, and this is how I would use the new functionality to create an analytical habit tracker to track both completion rates of individual habits and determine what weekdays produce the best results.
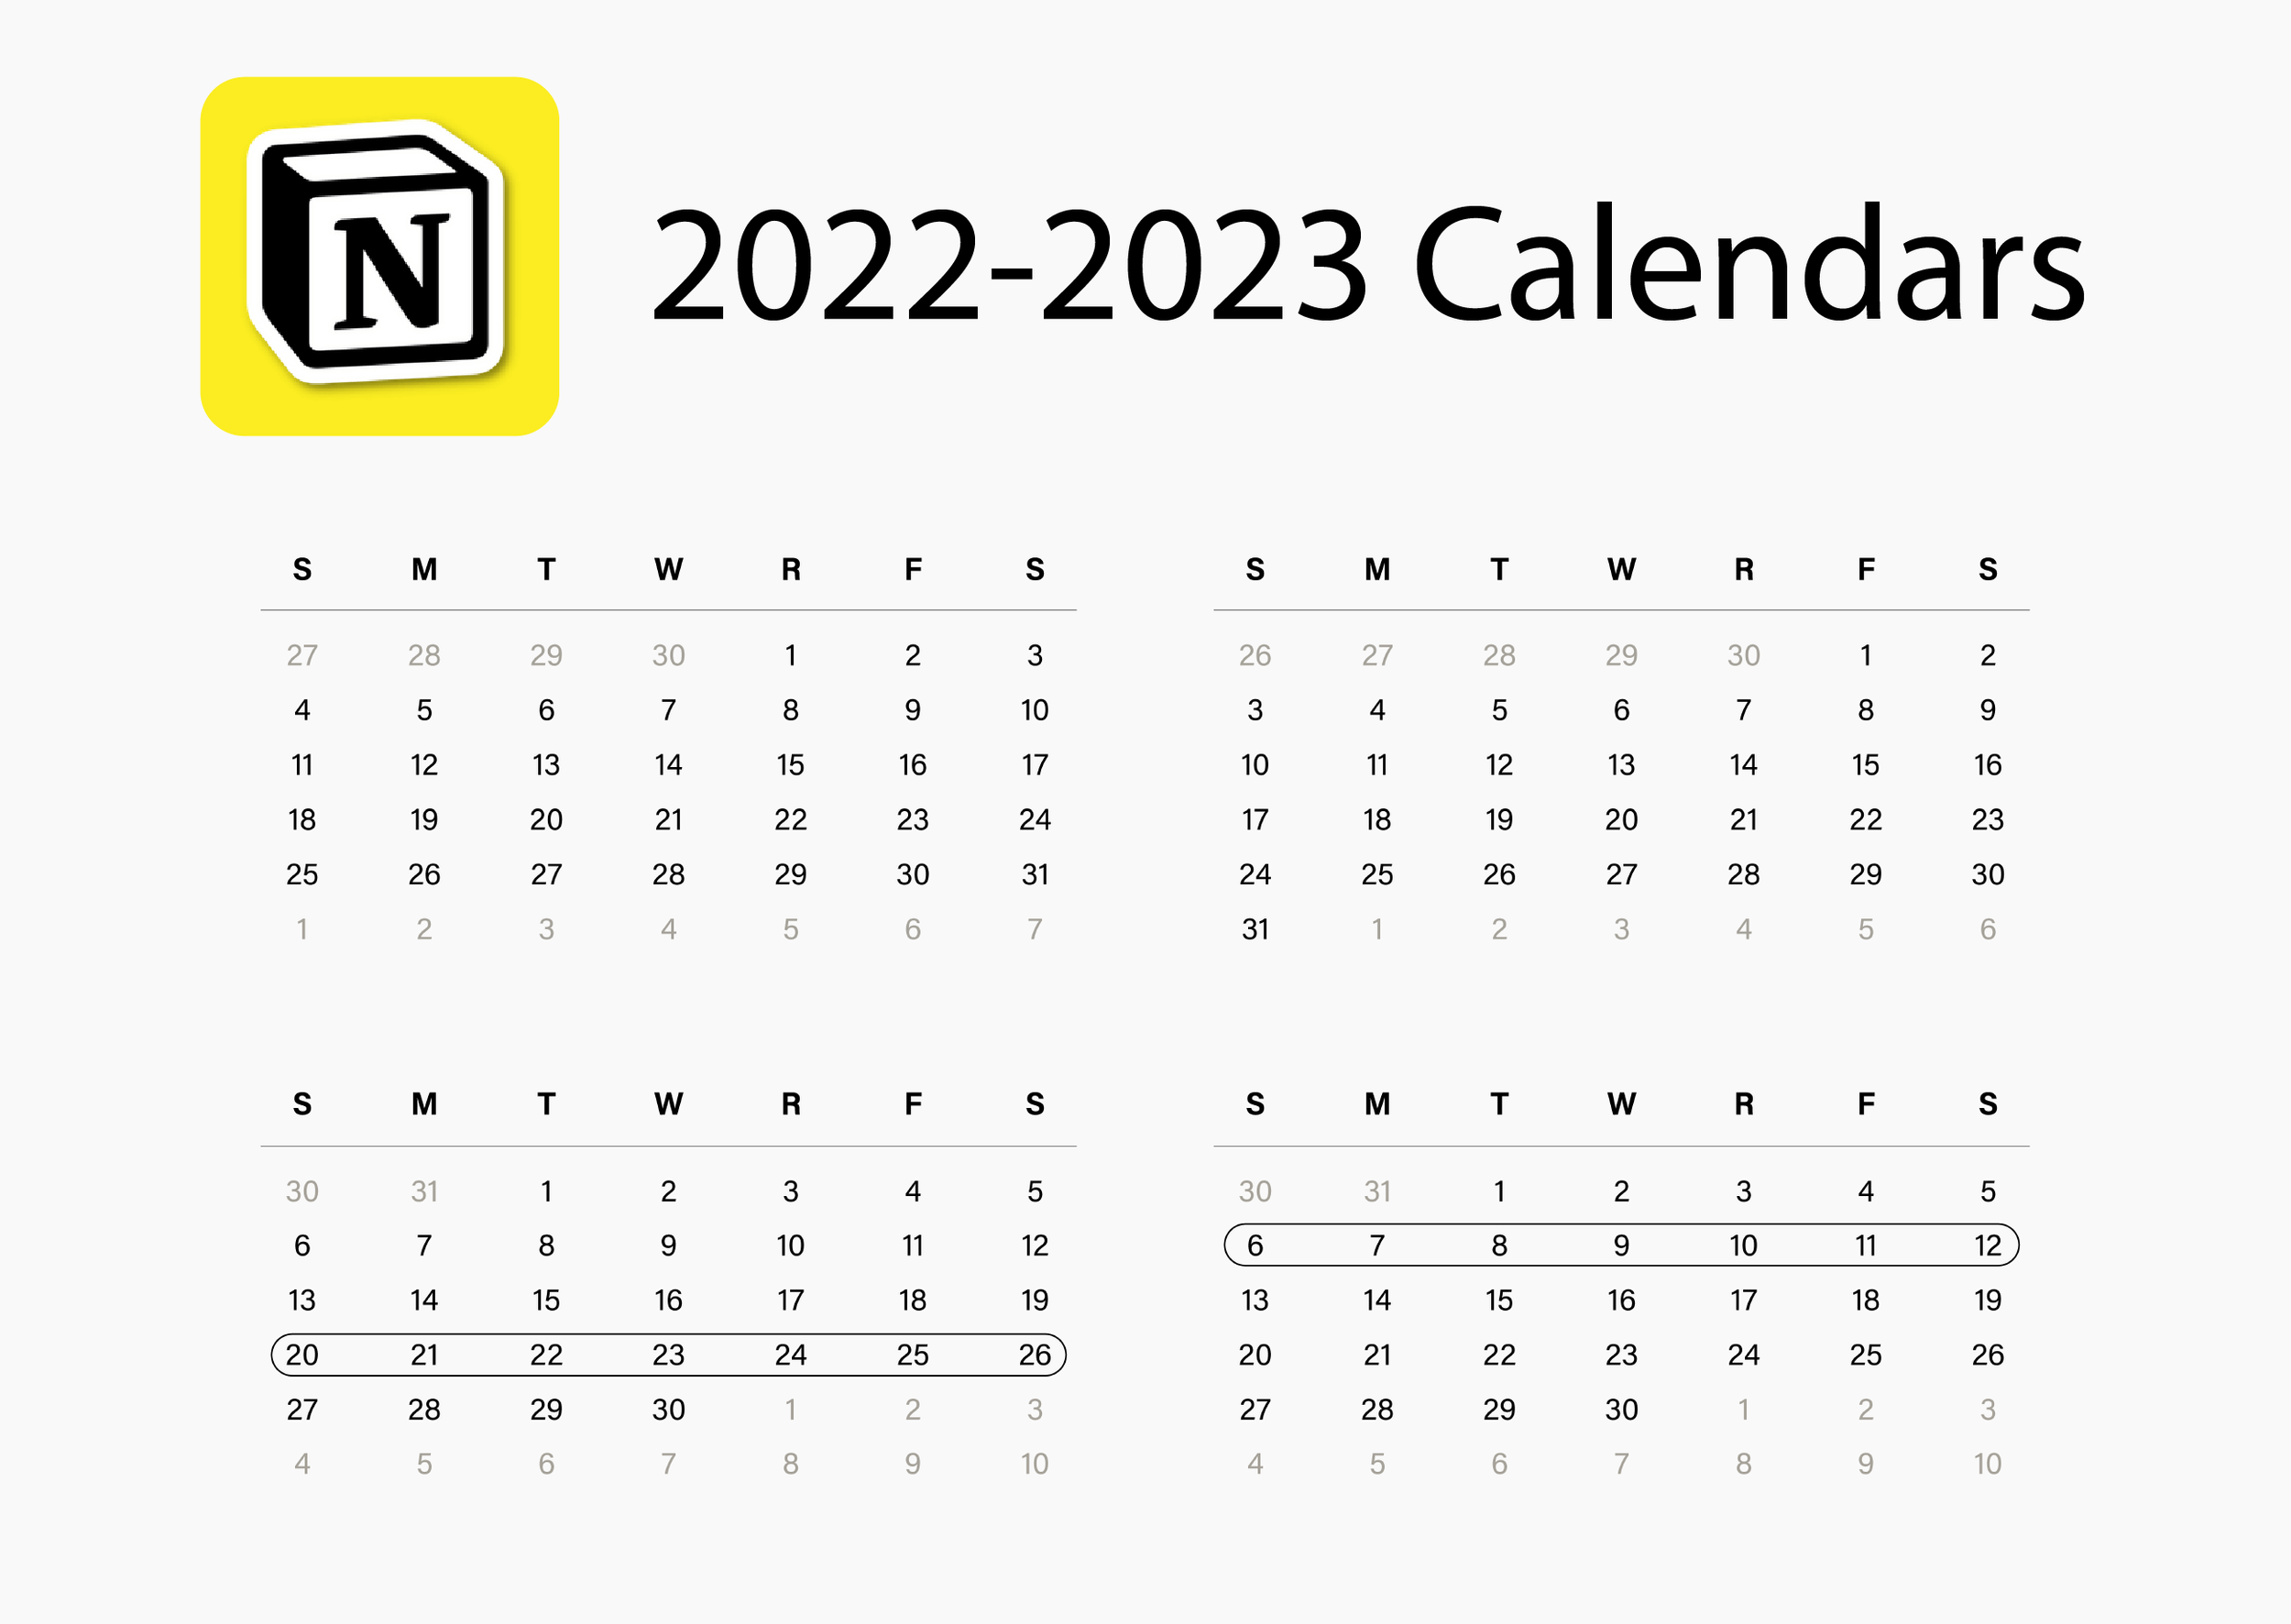
2022-2023 Notion Calendars
A bundle of calendar images for Notion galleries that span from Sep 2022 to Dec 2023 + more!
How To Build Habit Tracker Calendar
Build a habit tracker with a calendar database in Notion (trigger: /calendar).
Inside the new database, create a series of checkbox properties labeled as your desired habits for each day. These checkboxes will be used to calculate the progress bars.
You can show all checkboxes for easy access inside the calendar view via the Database Menu (…) > Properties > Show Checkboxes.
You can add a daily progress bar to calculate a completion rate for each day. All you need are a series of checkboxes and a formula property. This is the formula template to copy for 5 habits:
floor(1000 * (toNumber(prop("Name of checkbox 1")) + toNumber(prop("Name of checkbox 2")) + toNumber(prop("Name of checkbox 3")) + toNumber(prop("Name of checkbox 4")) + toNumber(prop("Name of checkbox 5"))) / 5) / 1000
To add more habits, add the following syntax:
toNumber(prop(”Name of checkbox”))
Next, change the 5 to the new total number of habits.
This formula should result in a number between 0 and 1. Convert this number into a percentage, and create a progress bar via the property menu.
Connect Calendar To A Tracker
In order to track the total success rate of each habit from the calendar, create a separate table database (trigger: /table view) with one entry inside like this:
Next, create a connection between the new Tracker table and the Habits calendar using a relation property. You can create a new property via the “+” next to the name property. Choose relation as the property type and select the database you want to connect to (Habits Calendar).
This connection can be modified to show a one-way or two-way relation. Here is how I configured my relation property inside the Tracker database:
To ensure every new daily habit day inside my Habits Calendar is connected to this “Habit Completion Rates” page, I created a filter inside the calendar that only shows days connected to the Tracker page.
Create a new filter via the filter button at the top of the calendar view, and select the relation > choose page to connect to.

How To Create Rollup Progress Bar
Inside the Tracker table, Create a series of rollup properties to track the overall success rates of each individual habit. A rollup allows you to calculate and aggregate data from a connected database. Therefore, a relation property is necessary for a rollup.
Create new rollups and configure each to communicate with the relation, locate the habit checkbox property, and calculate percent checked.
This will give you a percentage number that can be converted into a progress bar. Configure this progress bar in the same rollup menu. I gave each habit rollup a different color too.
With the same relation property to Tracker, you can also add more context for your analytics. I created a new database view inside Tracker via the “+” button at the top of the database.

This new database view will have seven entries for each day of the week.
I ensured that this “Weekday Rate” database view had a filter that excludes the page “Habit Completion Rates.” Inside the “Completion Rate” database view, a filter only allows for the page “Habit Completion Rates.”

Inside the Habits Calendar, a connection can be made in each day in the same relation property created earlier. Unlike the previous connection to the “Habit Completion Rates” page, the weekday connections must be made manually in each habit day.

Inside the Tracker database’s “Weekday Rate” view, simply show the same rollup properties you made earlier. In this view, you’ll be able to see how successful your habits are on a micro weekday level.
Because the weekday pages are connecting inside the same relation property as the “Habit Completion Rates” page, there is no need to create new rollups.
How To Calculate Rollups With A Notion Formula
In the same way you can create a formula that calculates the total average of daily habits in the Calendar, you can also calculate the total average of rollups in a single page.
Inside the Tracker database, create a formula property that finds the average of all habits for a given weekday or overall success rate with the following code:
floor(1000 * (prop("Name of rollup 1") + prop("Name of rollup 2") + prop("Name of rollup 3") + prop("Name of rollup 4") + prop("Name of rollup 5")) / 5) / 1000
You can show this total success rate formula in both Tracker database views via the Database menu (…) > Properties > Show formula.