
😅 A Mood Map
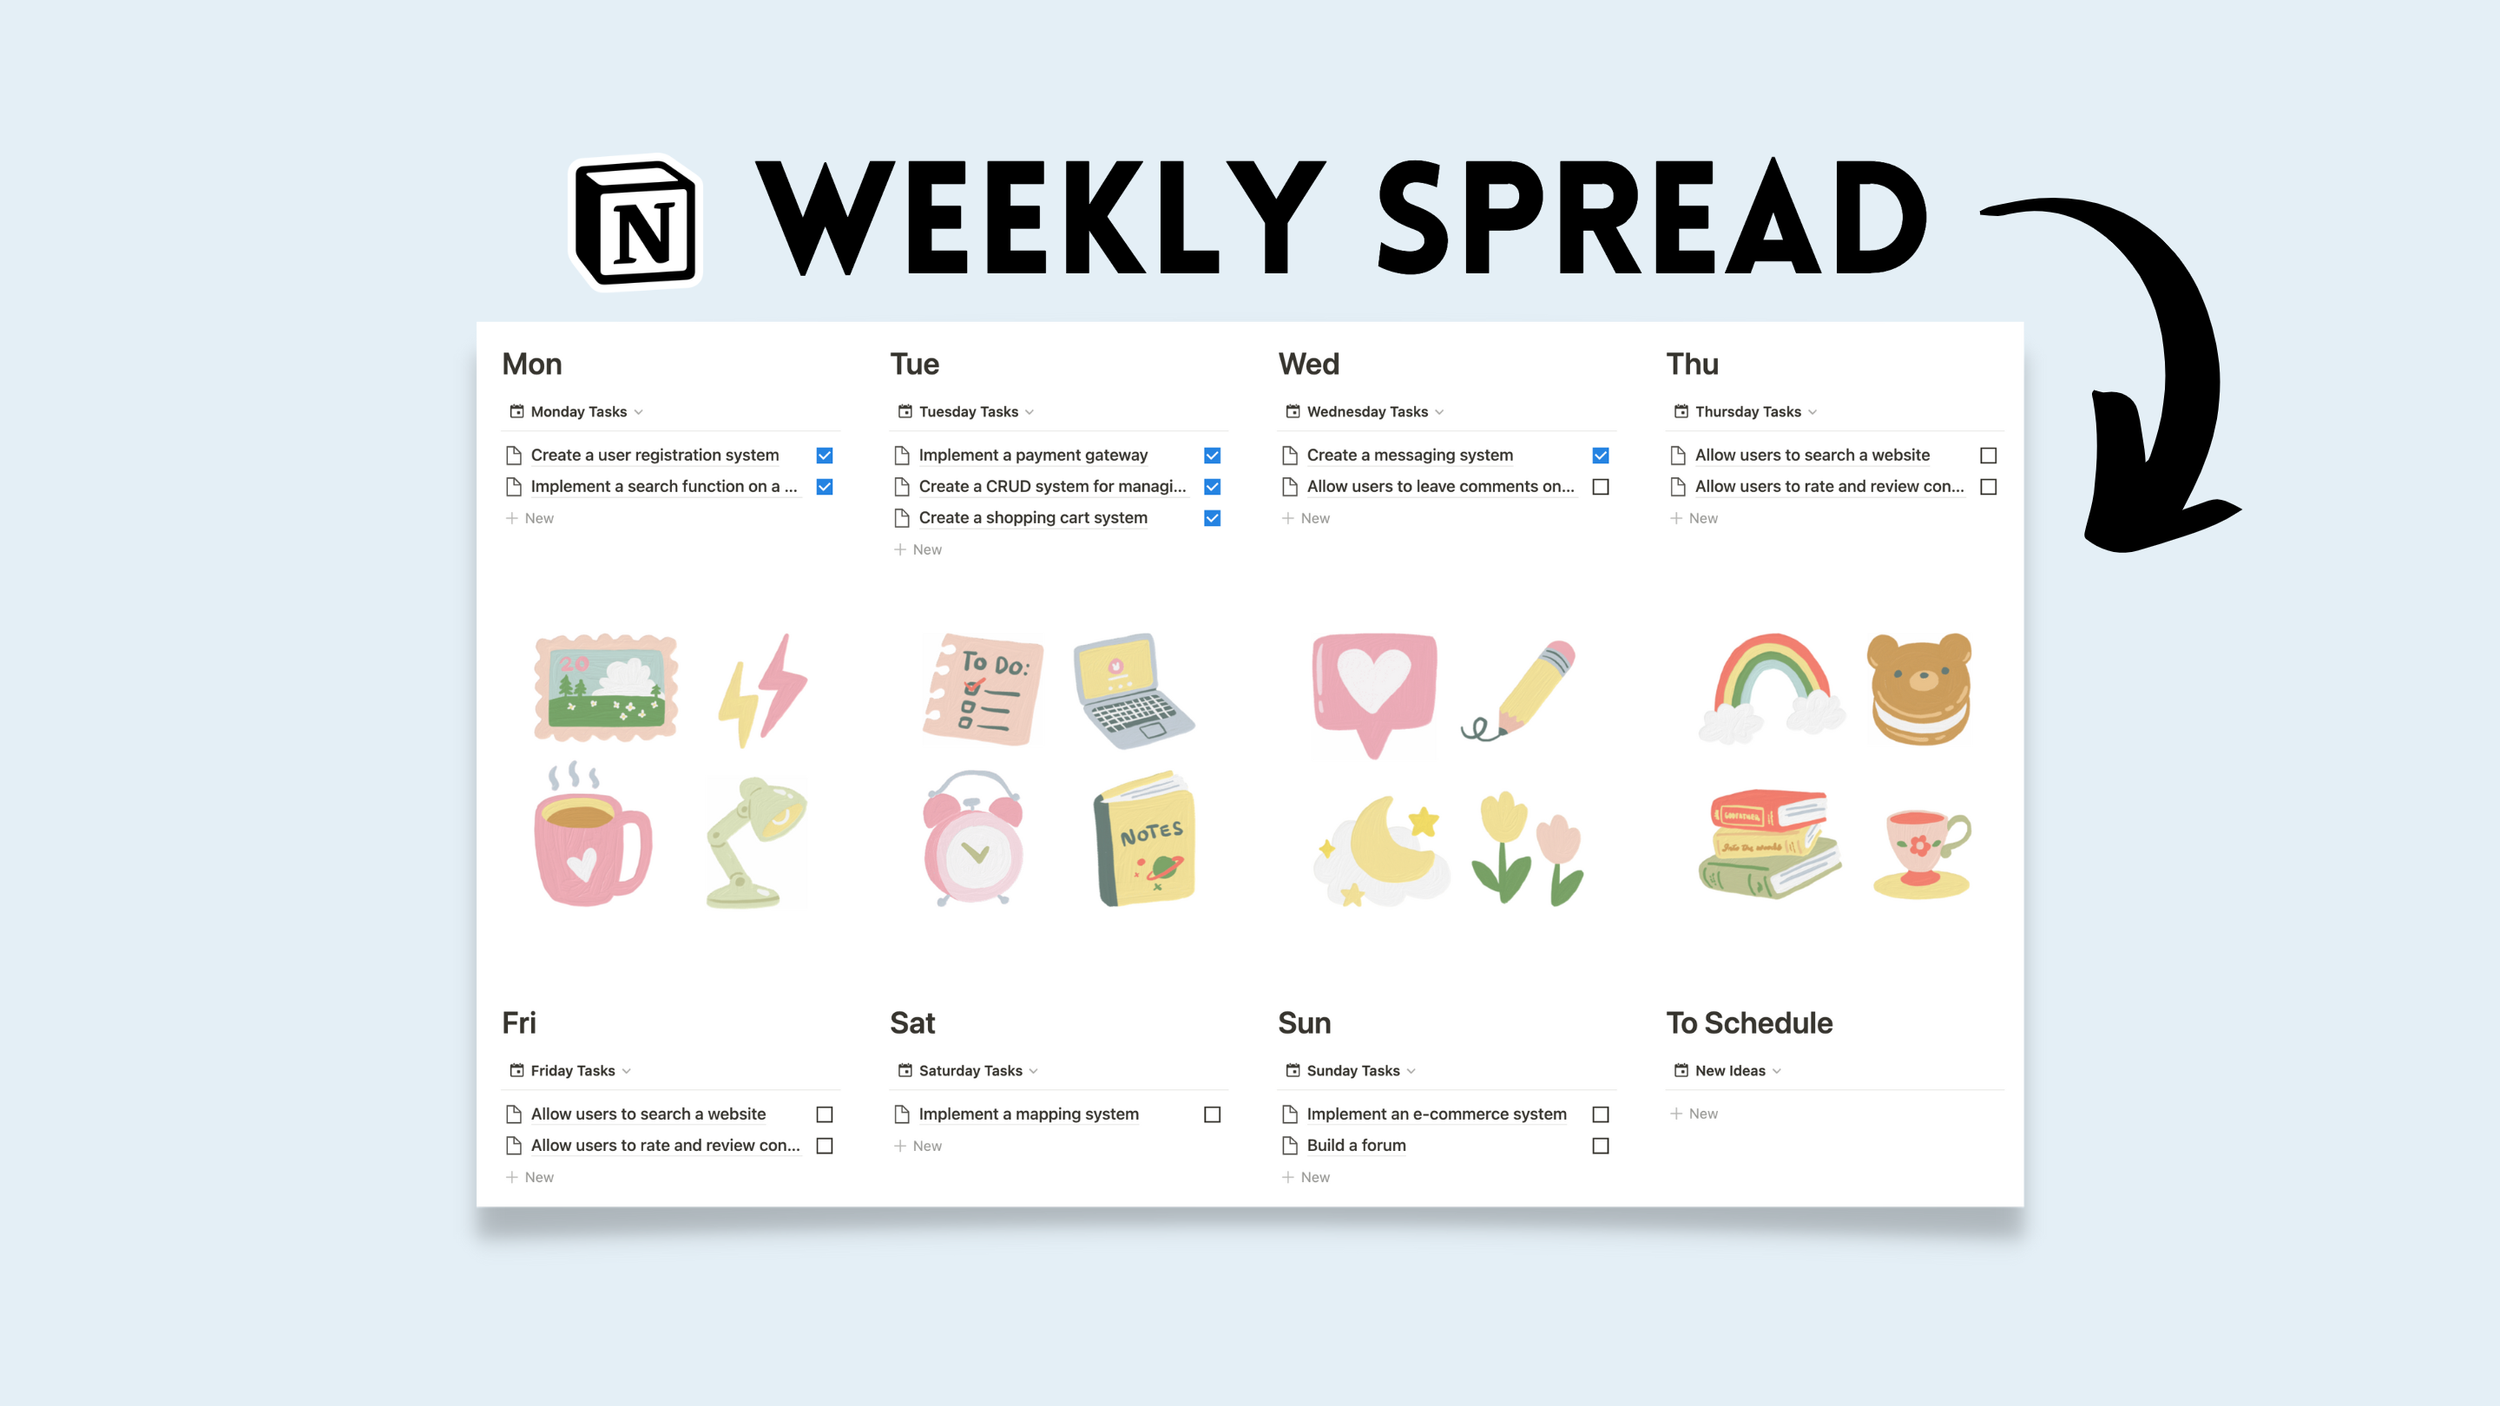
Whether you plan to enter a new year with a fresh mood tracker, or building your first in Notion, I hope this mood heat map can give you some inspiration. Included is a row for each week and a drop-down menu for each day of the week with mood options from poor to great. As well, there is a selection of emojis to add context.
The Heat Map Anatomy
There are 2 database views
Classic Table
This view is to input mood entries. Simply, every row is a week number, one column is for the dates that make up the week, and the other columns for Monday - Sunday.
Click to expand
Each day of the week has a drop-down menu that looks like this:

Gallery Card View
The second view displays each week as a card in a gallery. The date-range and moods from the week are displayed through each window. This view is sorted by: Date Ascending

The Reflection Journal Template
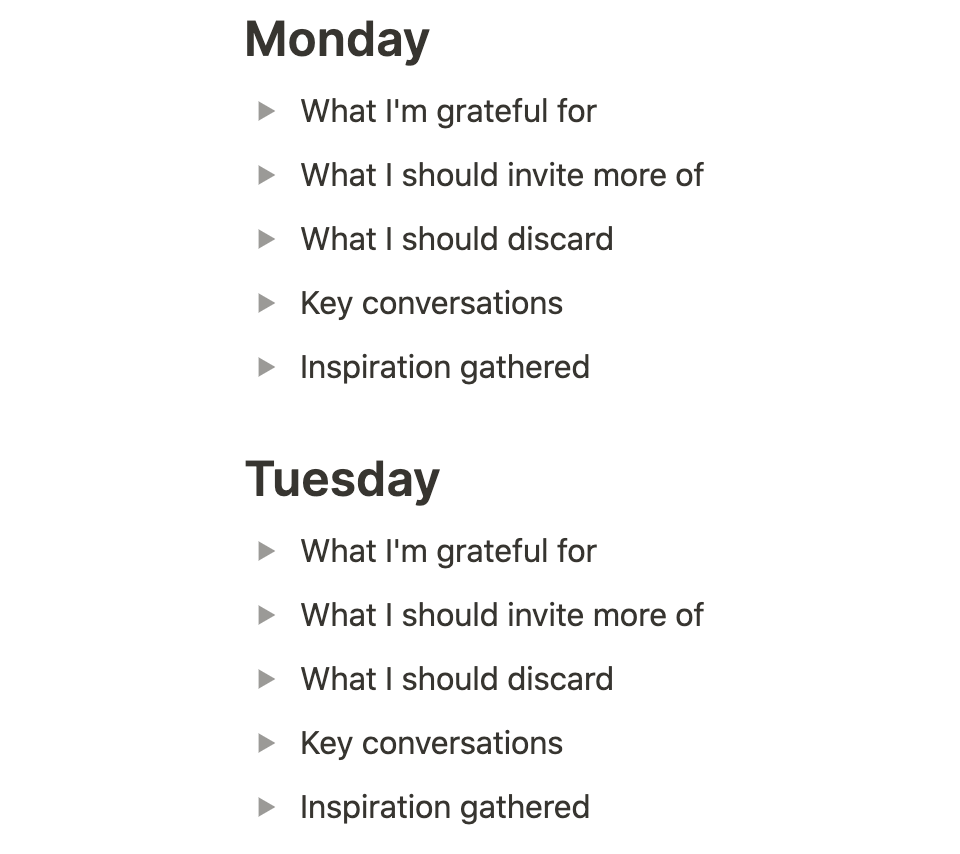
Included as well is a template upon creating a new week that prompts the user to answer these questions from Monday - Sunday:

I appreciate the simplicity of the drop-down menu for quick journal entries. I used a similar setup for 2020 and I managed to stick with it for a whole year.