📈 Analyze Columns
Are you looking for ways to calculate column values in a Notion database? There are many options to do so. Below, I go through each calculation option based off of property type in plain english. This is not a solution for calculating column data with a formula. Find more on how to do that here.
Database Calculations: Table v. Boardview
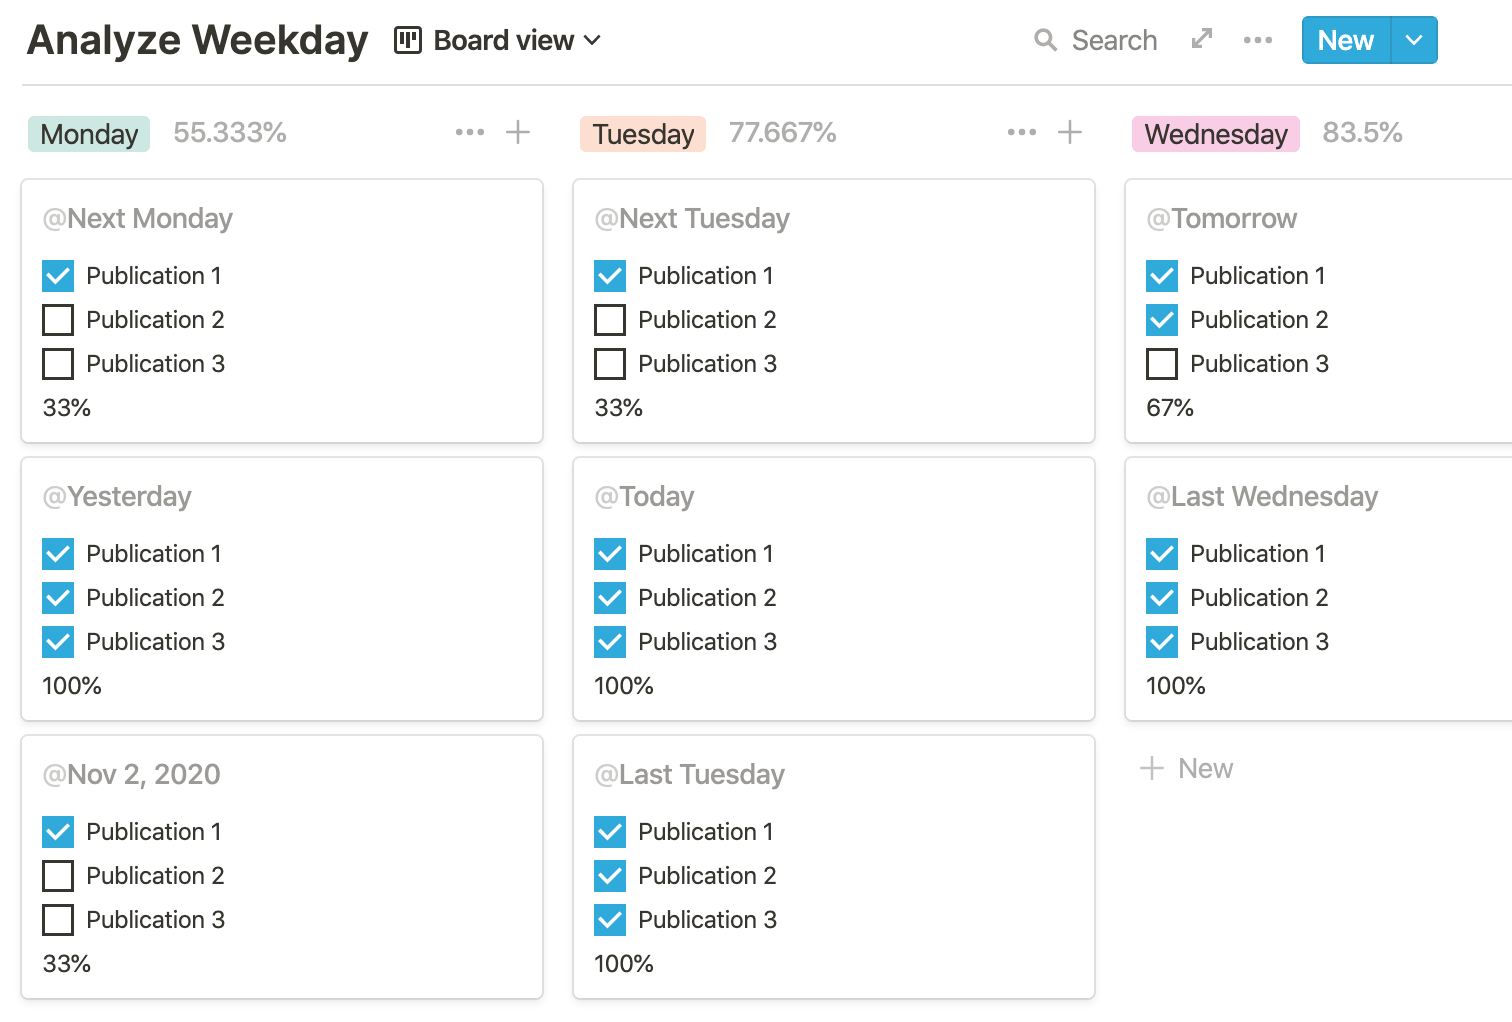
The calculate feature isn’t just available in tableview. You can also calculate data in boardview based off a select property. In the image below and above, for instance, my boardview is categorized by weekday. Now, I can analyze progress in relation to the day of the week.
In tableview, calculate columns at the bottom of the table
In boardview, calculate columns at the top of the table
Notion Calculation Options
Universal
Count All: Count all entries in a column
Count Values: Count all values in all column entries
ex. if entry is a “multi-select,” counts all tags applied
Count Unique Values: Count all values, excluding duplicates
ex. if select property displays 7 options and they are all applied, no matter the size of the column, the unique value count is 7.
Count Empty: All cells that are not populated.
remember: this does not apply to “unchecked” boxes.
Count Not Empty: All cells that are populate.
Percent Empty: Percentage empty in relation to total cells.
Percent Not Empty: Percentage populated in relation to total cells.
Checkboxes
Checked: All cells that are checked.
Unchecked: All cells that are unchecked.
Percentage Checked: Percentage checked in relation to total cells.
Percentage Unchecked: Percentage unchecked in relation to total cells.
DAtes
Earliest Date (See Above): Grabs the furthest date before today and returns a range from today in the following formats:
Displays “days” only up to 25
Then … displays “one month ago,” “two months ago,” etc.
Latest Date: Grabs the furthest date after today and returns a range from today.
Date Range: Finds the difference between the Earliest and Latest date, and returns the range.
ex. if the earliest date is Nov 2, 2020 and the latest is Nov 17, 2020, the range would display “15 days.”
Numbers
Sum: Add all values in a column.
Average: Find the average value of all values in a column.
Median: Find the middle value of all values in a column.
Why median? If data skews heavily to a high or low end in any point in time (of which may fluctuate), finding the median will not be as sensitive to these fluctuations.
Min: Find the lowest value in a column.
Max: Find the highest value in a column.
Range: Find the difference between the Min and Max values in a column.


